A new severity of illness scale using a subset of acute physiology and chronic health evaluation data elements shows comparable predictive accuracy
Abstract
Objectives: Severity of illness scores have gained considerable interest for their use in predicting outcomes such as mortality and length of stay. The most sophisticated scoring systems require the collection of numerous physiologic measurements, making their use in real-time difficult. A severity of illness score based on a few parameters that can be captured electronically would be of great benefit. Using a machine-learning technique known as particle swarm optimization, we attempted to reduce the number of physiologic parameters collected in the Acute Physiology, Age, and Chronic Health Evaluation IV system without losing predictive accuracy.
Design: Retrospective cohort study of ICU admissions from 2007 to 2011.
Setting: Eighty-six ICUs at 49 U.S. hospitals where an Acute Physiology, Age, and Chronic Health Evaluation IV system had been installed.
Patients: 81,087 admissions, of which 72,474 did not have any missing values.
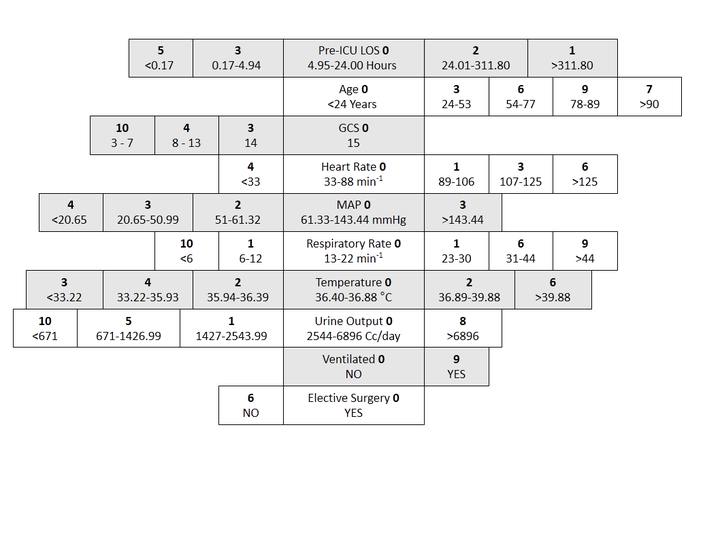
Measurements and Main Results: Machine-learning algorithms were used to come up with the minimal set of variables that were capable of yielding an accurate severity of illness score: the Oxford Acute Severity of Illness Score. Predictive models of ICU mortality using Oxford Acute Severity of Illness Score were developed on admissions during 2007–2009 and validated on admissions during 2010–2011. The most parsimonious Oxford Acute Severity of Illness Score consisted of seven physiologic measurements, elective surgery, age, and prior length of stay. Predictive models of ICU mortality using Oxford Acute Severity of Illness Score achieved an area under the receiver operating characteristic curve of 0.88 and calibrated well.
Conclusions: A reduced severity of illness score had discrimination and calibration equivalent to more complex existing models. This was accomplished in large part using machine-learning algorithms, which can effectively account for the nonlinear associations between physiologic parameters and outcome.
Performance comparison
| Data source | Score | AUROC | SMR |
|---|---|---|---|
| Hospitals across the USA (Cerner)*, 2010-2011 | OASIS | 0.837 | 0.91 [0.88, 0.94] |
| APS III | 0.822 | 0.95 [0.92, 0.98] | |
| Oxford, Oxon, UK (John Radcliffe) | OASIS | 0.776 [0.758, 0.795] | 1.122 [1.057, 1.189] |
| SAPS II | 0.767 [0.748, 0.786] | 0.704 [0.663, 0.745] | |
| APS III | 0.751 [0.731, 0.771] | 1.107 [1.042, 1.174] | |
| Boston, MA, USA (MIMIC-II) | OASIS | 0.790 [0.781, 0.799] | 0.921 [0.890, 0.952] |
| SAPS II | 0.802 [0.794, 0.811] | 0.559 [0.540, 0.578] | |
| APS III | 0.785 [0.775, 0.794] | 1.017 [0.984, 1.050] | |
| SAPS | 0.764 [0.755, 0.774] | - | |
| SOFA | 0.748 [0.738, 0.757] | - | |
| Original publication of score | OASIS | 0.837 | 0.91 [0.88, 0.94] |
| SAPS II | 0.860 | - | |
| APS III | - | - | |
| SAPS | 0.770 | - | |
| SOFA | - | - |
* AUROC confidence intervals were within 0.0003 of the reported value.
Details regarding these performance comparisons can be found in my thesis, available through the Oxford Research Archive, titled Mortality prediction and acuity assessment in critical care.
Code
This code is provided to ease the calculation of OASIS. If you have code for calculating OASIS in a different programming language, I would be happy to post it here and provide credit.
Clicking the below links will download the files to your computer.